A tally score or graph present the frequency of something, like scores. Unfortunately Excel does not include a tally graph, here we will create our own.
The final result will look like this:

We need some helper-columns – which we later can hide.
In D1 enter the following:
- ||||-
In E1 enter the following:
- |
The value in cell D1 will represent a group of 5, the value in E1 represents singles.
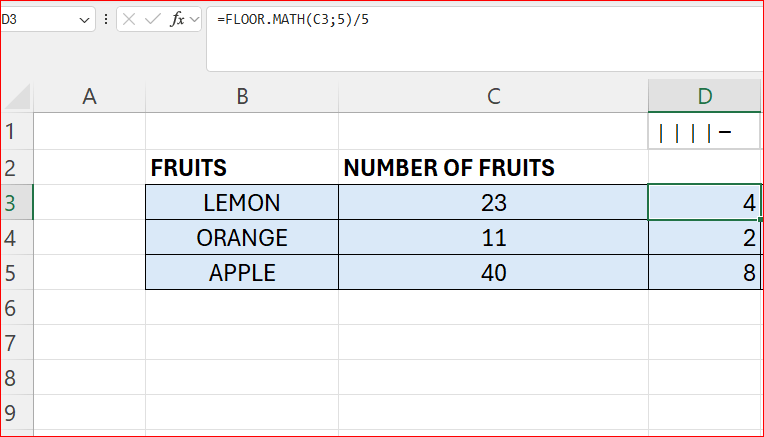
To calculate the groups insert a column and enter the formula:
- =FLOOR.MATH(C3;5/5)
Here we round the numbers down to the nearest multiple of 5, and then divide by 5.
Now we have to calculate what is left, we use the MOD function for this. Insert a new column and enter the formula below:
- MOD(C3;5)

Finally in the last column we use the REPT function to repeat the occurrences of each character and concatenate them. The formula looks like this:
- =REPT($D$1;D3)&REPT($E$1;E3)
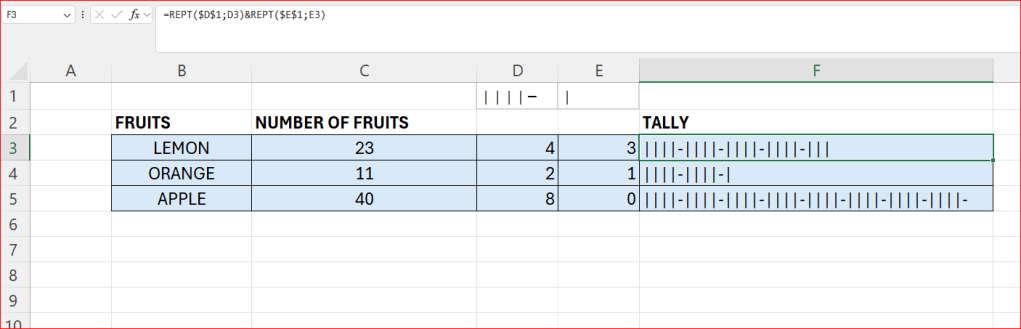
Now if we want we can hide the columns D and E for a cleaner presentation.

Leave a comment